
Younger entrepreneurs represent a smaller percentage of new business owners but still comprise about a quarter of all new small businesses.
Over the past 20 years, a look at the state of entrepreneurship in the United States shows remarkable changes in the demographics of who entrepreneurs are, where they set up shop, and the experiences they bring to bear on the landscape of American business.
The 2017 Kauffman Index of Entrepreneurship report on national trends since 1996 shows that the overall rate of startup activity in the nation rose slightly in 2016 after several years of steep increases. This recent trend reverses dramatic drops in such activity during the years during and immediately after the Great Recession.
In Exploring the State of American Entrepreneurship: A Look at the Stats, we take a deep dive into the trends and tracking of American business today.
The Kauffman Startup Activity Index measures entrepreneurship across three dimensions:
- The rate of new entrepreneurship, defined as the percentage of adults becoming entrepreneurs in a given month
- The opportunity share, defined as the percentage of entrepreneurs driven to the work by opportunity rather than necessity
- Startup density, defined as the rate businesses with employees are created
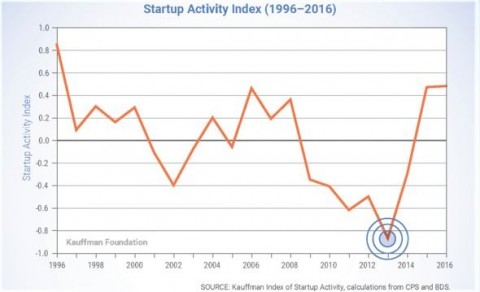
Based on those criteria, here is a closer look at some of the key Startup Activity Index trends in the 2016 data:
- In 2016, 0.31 percent, or 310 out of 100,000, of the adult American population created new businesses each month. In total, that rate translates to 540,000 Americans becoming self-employed business owners during the year.
- Recovery from the Great Recession has continued during the past three years but leveled off in 2016. The growth is fueled by people entering entrepreneurship out of a sense of opportunity rather than necessity.
- Despite the gains in the past three years, entrepreneurship still lags behind pre-Recession levels.
Startup Density Dropping
One dramatic reflection in the Kauffman data is the startup density, which measures the total number of employees hired by new entrepreneurial companies. It is different from the rate of new entrepreneurs, which indicates only the individual entrepreneurs themselves.
Here, a startup is defined as a business that is less than a year old and employing at least one person (other than the entrepreneur). Researchers use startup density as an indication of how vibrant an entrepreneurship ecosystem is, with higher levels reflecting larger companies with more initial hiring.
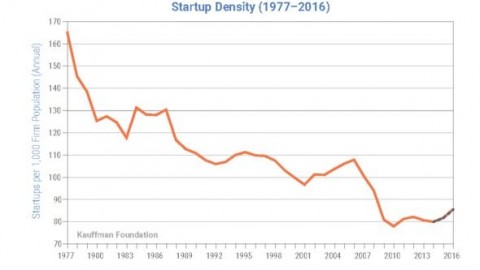
The startup density rates lag by about two years, so the last year of available data is 2014. Since 1977, startup density has sloped downward, precipitously so in the years just before, during, and after the Great Recession.
An estimated startup density of 85.4 for 2016 represents about 448,000 new employer businesses. However, despite a slight projected uptick, startup density lags about 20 points lower than during the recession.
New Entrepreneurs by Gender
Overall, the percentage of new entrepreneurs who are women has dropped since 1996, when they represented 43.7 percent of the total, compared to 39.5 percent in 2016.
In 2016, the rate of new entrepreneurs declined for both genders. The rate dropped to 0.39 percent among men and to 0.23 percent among women. During the 20 years of the Kauffman data collection, men have outpaced women in the rate of new entrepreneurs consistently, though during the Great Recession, the rate dropped more dramatically among men.

New Entrepreneurs by Race and Origin
The growth among Latino entrepreneurs has been dramatic in the 20 years of Kauffman analysis, reflecting the increase in the Latino population as a whole. The rate of Latino entrepreneurs grew significantly, from 10 percent to 24.1 percent since 1996.
Between 2015 and 2016, the rate of new Asian and Latino entrepreneurs grew at notable rates, from 0.29 to 0.34 and from 0.46 to 0.48, respectively. The rate among African American entrepreneurs dropped slightly, from 0.23 to 0.22.
Here are the changes in the racial breakdown from 1996 to 2016, showing that while white entrepreneurs continue to have the largest percentage of entrepreneurship, there have been steady gains by other races:
Percentage of New Entrepreneurs by Race, 1996-2016
| Race | 1996 | 2016 |
| White | 77.1 | 55.6 |
| Black | 8.4 | 9.2 |
| Asian | 3.4 | 7.6 |
| Latino | 10.0 | 24.1 |
| Other | 1.0 | 3.5 |
Immigrant entrepreneurship has increased considerably since 1996 when the rate was just 0.36. Today, immigrants comprise 29.5 percent of the total new entrepreneurs, compared to fewer than half that amount – 13.3 percent – 20 years earlier. Among immigrants, the rate of new entrepreneurship has remained at 0.52 or 0.53 in the past three years, after peaking at 0.62 in 2010.
New Entrepreneurs by Age
Entrepreneurs are getting older. That is the clear conclusion from a look at the Kauffman data. The percentage of new entrepreneurs among the youngest Americans (ages 20-34) has dropped by 10 percentage points while those among the oldest Americans (ages 55-64) has increased by roughly the same amount.
Twenty years ago, young Americans represented the largest percentage of entrepreneurs, while today they represent the smallest. However, the rate is also more balanced among the four identified groups, with each representing roughly a quarter of total new entrepreneurs.
Percentage of New Entrepreneurs by Age, 1996-2016
| Age | 1996 | 2016 |
| 20-34 | 34.3 | 24.4 |
| 35-44 | 27.4 | 24.0 |
| 45-54 | 23.6 | 26.1 |
| 55-64 | 14.8 | 25.5 |
When looking at the rate of new entrepreneurs, all age groups have seen a decline in recent years. However, when looking at the past 20 years, the rates have held steady or grown slightly for all but the youngest group. Those aged 55-64 saw a 0.34 rate in 1996, reached a high of 0.4 in 2009, and were at 0.37 in 2014 and 2015 while dipping to 0.35 in 2016.
Those aged 45-54 have remained flat over the 20 years, starting at 0.36 and hovering between 0.34 and 0.37 between 2006 and 2016.
The rate of new entrepreneurs among the youngest Americans has slipped over time, from 0.28 in 1996 to a low of 0.18 in 2013 and sitting at 0.22 in 2016.
New Entrepreneurs by Education Level
More education translates to a higher level of entrepreneurship, though the rate of new entrepreneurs is highest among those with the lowest educational levels.
In 1996, nearly 50 percent of new entrepreneurs were those with a high school education or less. Today, those same cohorts represent about 43.6 percent. Conversely, those with some college education or a college degree represent 56.4 percent of new entrepreneurs, up from about 50 percent two decades prior.
New Entrepreneurs by Veteran Status
Military veterans make up an ever-declining percentage of the working population as members of the Baby Boom and post-Baby Boom generations retire. It is no surprise that the percentage of veteran new entrepreneurs has dropped accordingly. In 1996, only 12.5 percent of new entrepreneurs were veterans. In 2016, that number was just 4.2 percent.
Large States, Small States
When breaking down the national data into large and small states, we see some familiar and surprising names associated with business growth near the top. Here are the top 10 large states and small states in terms of the rate of startup growth:
Rate of Startup Growth, Large and Small States
| California | 0.42 | Hawaii | 126.2 | |
| Texas | 0.4 | Alaska | 82.6 | |
| Arizona | 0.4 | Utah | 77.5 | |
| Florida | 0.38 | Oregon | 70.8 | |
| New York | 0.36 | Montana | 69.7 | |
| Colorado | 0.35 | North Dakota | 69.2 | |
| North Carolina | 0.34 | Maine | 67.8 | |
| New Jersey | 0.34 | New Mexico | 67.4 | |
| Georgia | 0.33 | Kentucky | 67.2 | |
| Missouri | 0.3 | Nevada | 66.2 |
Rate defined as how much startups have grown as a cohort on average, five years after founding, measured by change in employment
However, the rate of growth is not a fully complete representation of entrepreneurship health. Kauffman also looks at the share of companies that started small but within a decade employed 50 people or more. The foundation further examines high growth, measured as how many private businesses in a state with at least $2 million in annual revenue and three years of normalized annual revenue growth of 20 percent.
With these additional dimensions factored in, here are Kauffman’s top-ranked large and small states for entrepreneurship:
Growth Entrepreneurship Rankings, Large and Small States
| 1. | Virginia | Utah | |
| 2. | Georgia | Hawaii | |
| 3. | Maryland | North Dakota | |
| 4. | Massachusetts | Nevada | |
| 5. | Texas | New Hampshire | |
| 6. | Arizona | Delaware | |
| 7. | Ohio | Oklahoma | |
| 8. | Colorado | Kansas | |
| 9. | Minnesota | West Virginia | |
| 10. | Tennessee | Oregon |
Following the same criteria, here are the top 10 metropolitan areas for entrepreneurial growth:
Growth Entrepreneurship Rankings, Metropolitan Areas
| 1. | Washington-Arlington-Alexandria (DC-VA) |
| 2. | Austin-Round Rock-San Marcos (TX) |
| 3. | Columbus (OH) |
| 4. | Nashville-Davidson-Murfreesboro-Franklin (TN) |
| 5. | Atlanta-Sandy Springs-Marietta (GA) |
| 6. | San Jose-Sunnyvale-Santa Clara (CA) |
| 7. | San Francisco-Oakland-Fremont (CA) |
| 8. | Boston-Cambridge-Quincy (MA) |
| 9. | Minneapolis-St. Paul-Bloomington (MN) |
| 10. | Indianapolis-Carmel (IN) |
While the state of entrepreneurship has evolved over the past 20 years, the need for business financing has not. New entrepreneurs have multiple options when it comes to financing. Some choose to pursue startup business loans from a traditional lender, only to face difficulties in securing enough dollars or facing rigid lending requirements.
Others turn to venture capital or crowdfunding, which have limited availability and application to many small businesses.
At Benetrends, we offer a different alternative. Benetrends has helped hundreds of small-business owners leverage existing 401(k) and IRA funds. Using our unique approach, businesses that organize as C corporations can convert existing retirement funds into capital in a matter of weeks, giving entrepreneurs the funds to start or grow their business.
To learn how Benetrends can help you achieve your small-business goals, download The Definitive Guide To 401(k)/ROBS Business Funding.